
Budapest weather by month
Budapest has warm summers and cold winters. Spring and autumn sit in between, with mild days and cool nights. The numbers below are monthly averages for 1991 to 2020 at the Budapest-Pestszentlőrinc station. They describe a typical month, not the weather on your dates, and they are not measured on Castle Hill itself.
If you plan around the weather, check the forecast a few days before you go, and see Buda Castle tours for guided walks on the hill.

Our pick: cave walk
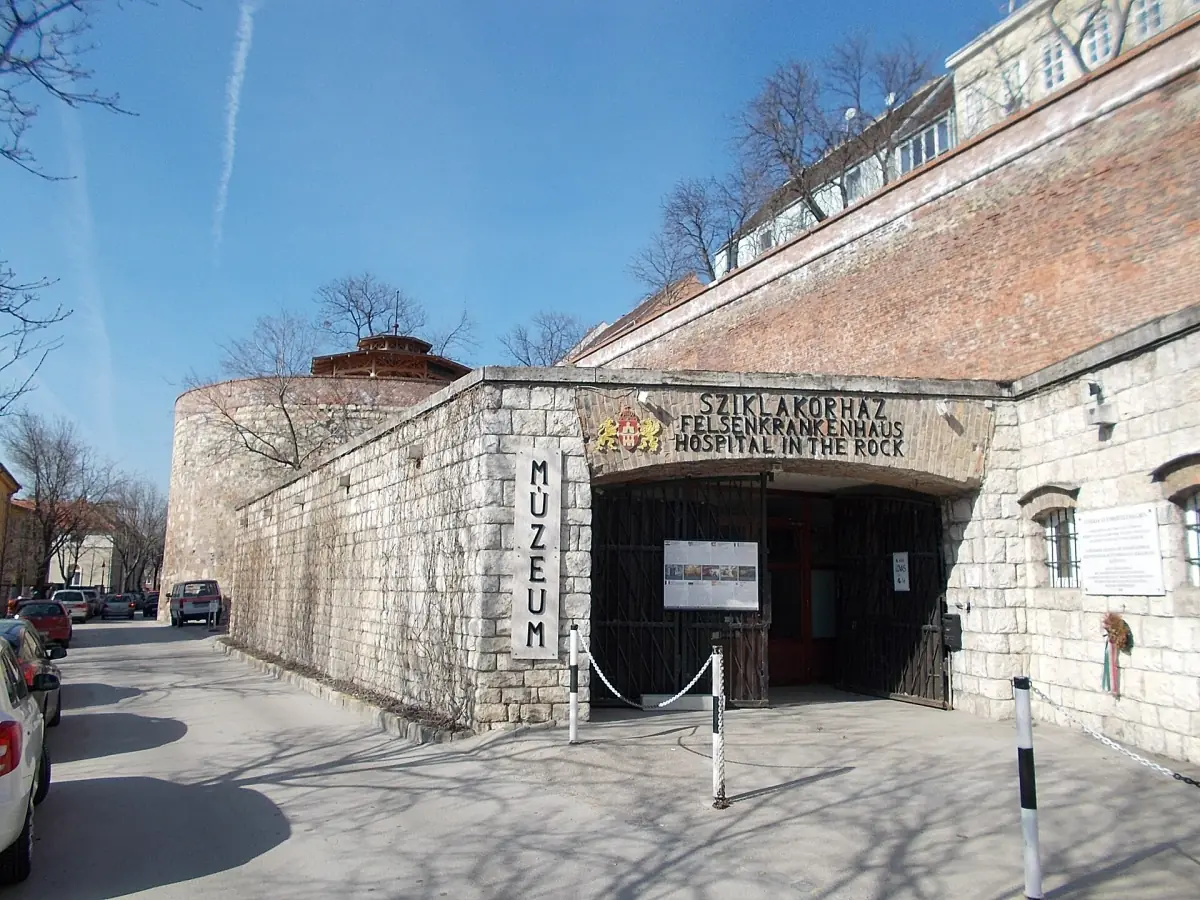
The route runs under the castle hill, so it still works on a day when the weather outside is poor.
Hand-picked tours, booked through GetYourGuide. Prices are indicative starting prices in euros (as of October 2026). Tap a tour for live availability and the current price in your currency.
Budapest tours in any weather
Castle district walks, city tours, river cruises and day trips from Budapest, with live prices and availability. Check what each tour includes before you book.
Average temperature and rainfall by month
Daily highs and lows are averages, rainfall is the average monthly total.
| Month | Average high | Average low | Rainfall |
|---|---|---|---|
| January | 3.0 °C | -2.5 °C | 31 mm |
| February | 5.8 °C | -1.3 °C | 33 mm |
| March | 11.3 °C | 2.3 °C | 32 mm |
| April | 17.9 °C | 7.1 °C | 36 mm |
| May | 22.6 °C | 11.6 °C | 67 mm |
| June | 26.2 °C | 15.2 °C | 66 mm |
| July | 28.1 °C | 16.7 °C | 75 mm |
| August | 28.0 °C | 16.6 °C | 61 mm |
| September | 22.5 °C | 12.2 °C | 52 mm |
| October | 16.4 °C | 7.2 °C | 45 mm |
| November | 9.4 °C | 3.1 °C | 48 mm |
| December | 3.5 °C | -1.4 °C | 40 mm |
The highs are average daily maxima, not record temperatures. A cold or hot spell can sit well away from these values, so use the table to pick a season and the forecast to pick a day.
Best time to visit Budapest
A planning guide from the monthly averages, not a promise of good weather.
May and September for walking
May and September have average highs of 22.6 °C and 22.5 °C, which suits long walks on Castle Hill and along the river. September is the drier of the two, with 52 mm against 67 mm in May.
July and August for the warmest days
These months have the highest average highs, 28.1 °C and 28.0 °C, and nights around 16.6 to 16.7 °C. Plan the castle walk for the morning and keep water with you.
April and October as mild alternatives
April averages 17.9 °C and October 16.4 °C by day, with lows around 7 °C. Bring a light jacket.
December to February for the cold
December, January and February have average lows below freezing, between -2.5 °C and -1.3 °C, and highs of 3.0 to 5.8 °C. Do not count on snow, the averages do not promise it. For the markets, see Budapest Christmas market 2026.
Weather and the castle district
What to adjust on a wet or hot day.
On a wet day, the indoor options in the castle district help. The Budapest History Museum is open daily from 10:00 to 18:00 in 2026, with last entry at 17:30. See Buda Castle tickets and opening hours for the other museums.
On a hot day, go early. The ticketed hours on the Fisherman's Bastion in 2026 run from 09:00 to 21:00 between 1 June and 30 September, so you can also come in the evening. Read more on the Fisherman's Bastion.



Budapest weather: frequently asked questions
What is the best time to visit Budapest?
May and September suit walking, with average highs around 22.5 °C. September is drier than May on average. The averages are a guide, not a guarantee of good weather.
What is the warmest month in Budapest?
July, with an average high of 28.1 °C and an average low of 16.7 °C. August is almost the same.
Which month has the most rain?
July has the highest average rainfall at 75 mm, followed by May at 67 mm and June at 66 mm.
How cold does Budapest get in winter?
December, January and February have average lows between -2.5 °C and -1.3 °C. Daytime highs average 3.0 to 5.8 °C in January, February and December.
Are these figures a forecast?
No. They are averages for 1991 to 2020 at the Budapest-Pestszentlőrinc station. Check a forecast for your dates before you go.